BULLISH PATTERNS
1)Morning Star-
O:Open, H:High, L:Low, C:Close
An infrequently appearing pattern, if Morning Star is visible after a downtrend, it indicates the possibility of a reversal in a bearish trend. First, a red candle, which should be a long one, appears representing an ongoing downtrend. On the second day, another ideally smaller candle appears, whose full body is usually shorter than the first-day's candle. This indicates that the downward momentum is slowing. Before a change of trend, the momentum of the trend needs to change. Then a third candle, which is long and green, appears to indicate that the demand equation has changed in favor of the bulls. A confirmation, if it comes by way of the third day's candle breaking above the downward sloping resistance giving trend line, sharply increases the probability of the bulls winning the battle.
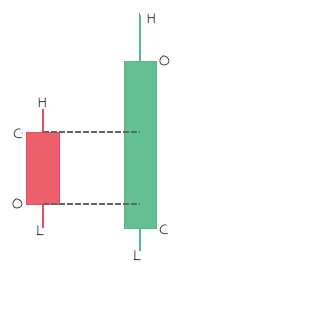
2)Bullish Engulfing-
O:Open, H:High, L:Low, C:Close
This formation has a higher probability of successfully indicating a change in an ongoing trend. Traders need to check where the bullish engulfing pattern has emerged. If it is appearing after a phase of downward movement, it is indicative of possible reversal from bearish to bullish. If it appears after a sideways movement or just after a short correction of two to four trading sessions with shallow price damage, it may be an indication of resumption of the upward trend. So, a Bullish Engulfing pattern may be a reversal pattern or continuation pattern. Longer the second green candle, stronger the strength of bullish indication emerging on the charts.
3)Hammer-
O:Open, H:High, L:Low, C:Close
An indication of possible reversal in sentiments from bearish to bullish, a hammer formation is prone to maximum misinterpretation. Many candles might appear to the eye as a hammer due to subjectivity in terms of what should be the size of the wick and body and the ratio in between them. At times, the color of the body also gives misleading indications. It might appear anywhere in price charts, but the ones which appear after a long downward move tend to give more reliable indication of reversal in ongoing bearish trend. The appearance of this candle should act as just an alert to do more work on charts.
4)Inverted Hammer-
O:Open, H:High, L:Low, C:Close
While it is a bullish formation, an inverted hammer rather than being an indication of the exact point of reversal of trend, normally gets formed as a first step in the process of reversal of trend from bearish to bullish. This formation is an indication that the bulls have made their first attempt to fight back. Long upper wick indicates that some selling pressure did emerge at a higher level. The appearance of an inverted hammer requires more confirmation in terms of breakout of prices above the downward sloping trend line along with a gap up opening on the day after the formation appeared.
Bearish Patterns
1)Doji-
O:Open, H:High, L:Low, C:Close
is strongly bearish or strongly bullish candle formation. It is one of the most peculiar candle formations as there is no intraday price movement in the stock but then even it says a lot about what might happen to the stock in near term. This formation which appears as just a small horizontal line indicates the possibility of the start of super bullish or super bearish trend in a stock. This formation does not appear occasionally, but when it appears on charts, traders should get ready for a big one way move in the counter.
2)Evening Star-
O:Open, H:High, L:Low, C:Close
An infrequently visible pattern, an Evening Star indicates a high probability of reversal in an ongoing uptrend. When it appears after an uptrend, it has a reasonably good chance that the uptrend would come under threat sooner than later. The first day, a long green candle appears to reflect an ongoing uptrend. On the second day, a small candle, preferably red, appears to indicate that the momentum is shifting against the bulls. A third candle, which is a red one and preferably a long one, then indicates increased selling pressure and the bulls come under pressure. If this formation is accompanied by the price breaking below a support-giving trend line, then it confirms that the price may come under further pressure.
3)Bearish Engulfing-
O:Open, H:High, L:Low, C:Close
A candle formation with high success rate, bearish engulfing formation is both an indication of reversal in trend and continuation in pattern. If formed after an uptrend and confirmed by a candle formed after the appearance of the bearish engulfing pattern, then it is a sign of reversal in trend. If this candle formation appears when a stock had seen a sudden fall and for some time it is moving in sideways correction, then it is a continuation formation. The first candle which is green is completely engulfed by the second red color candle. Longer the second red candle, stronger the signal that the bulls will be in trouble.
4)Hanging Man-
O:Open, H:High, L:Low, C:Close
Hanging man is a signal candle formation which indicates towards a possible reversal of trend from bullish to bearish. It is one candle formation which is prone to maximum misinterpretation because many candles might appear to the eye as hanging man due to subjectivity in terms of what should be the size of wick and body and the ratio between them. Also, at times the color of the body can be misleading. While it might appear anywhere in price charts, the ones which appear after a long uptrend tend to give more reliable indication. The appearance of this candle should act as an alert to do more work on charts.


Keep it up
ReplyDelete